Monstera album release show @ Paradiso, 21-04-2025.
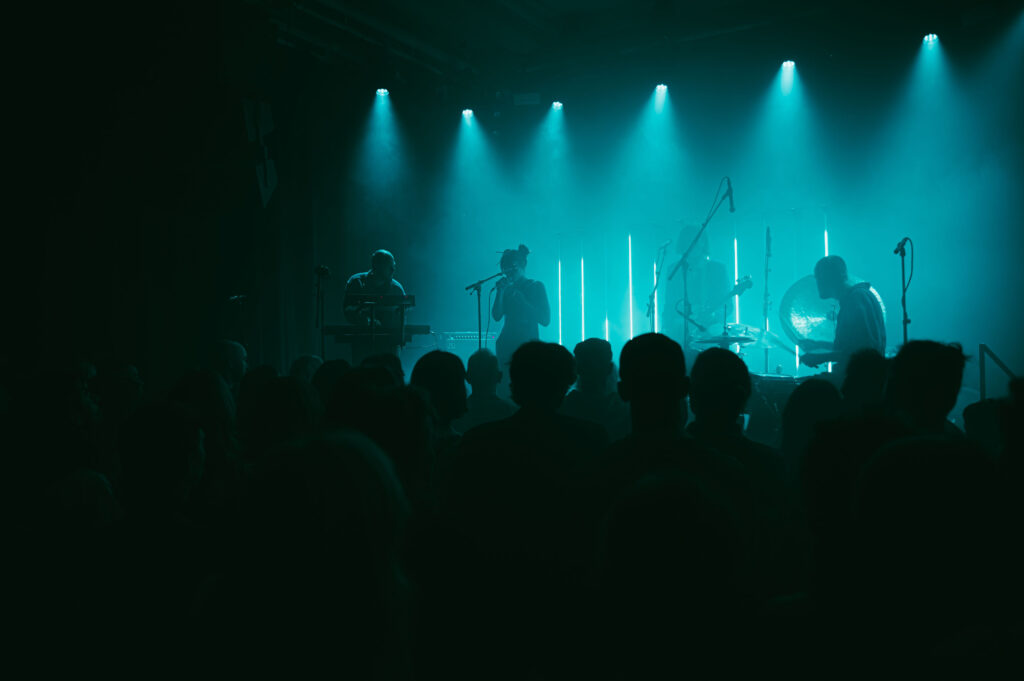
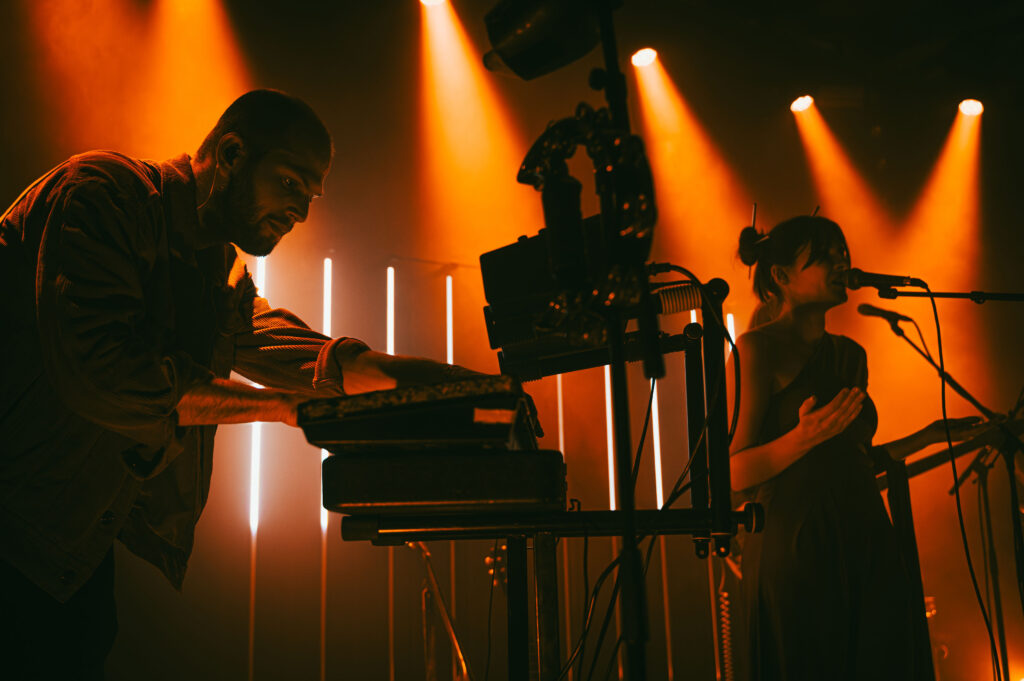
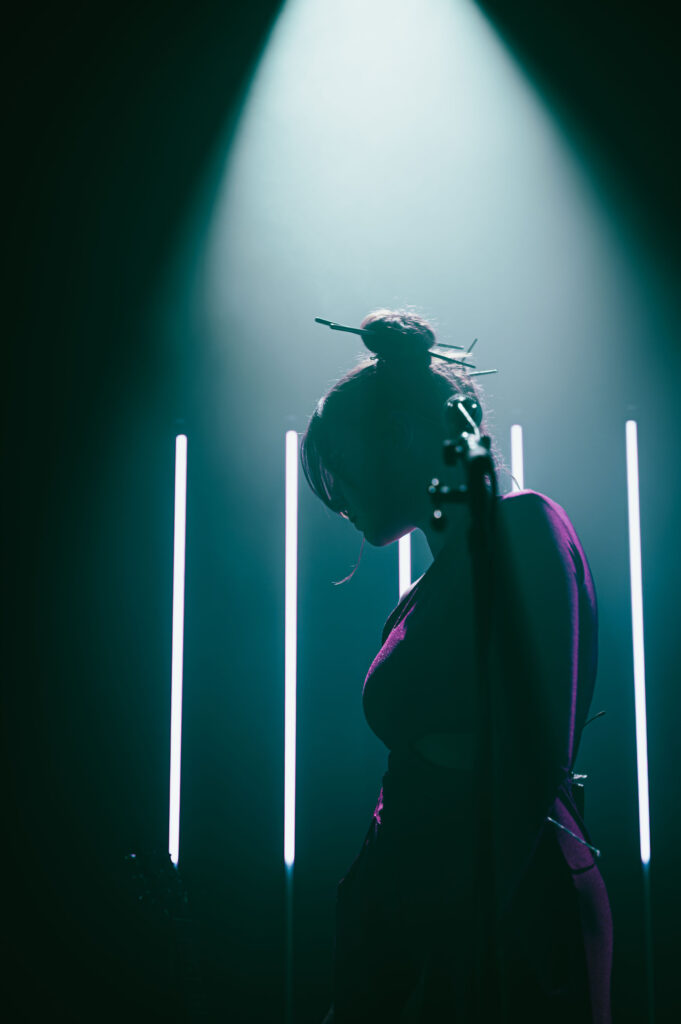
Monstera album release show @ Paradiso, 21-04-2025.


Custom hardware inside of 12 IKEA classics. Wireless communication and battery powered. Controlled live by custom software that generates both composition and sound
Camera by @koenbou
Audio mix by @samhighstreets
Production by @viviannejorritsma
Jonisks by @ikbenjelte
As seen on http://thisisyourcaptainspeaking.nl/
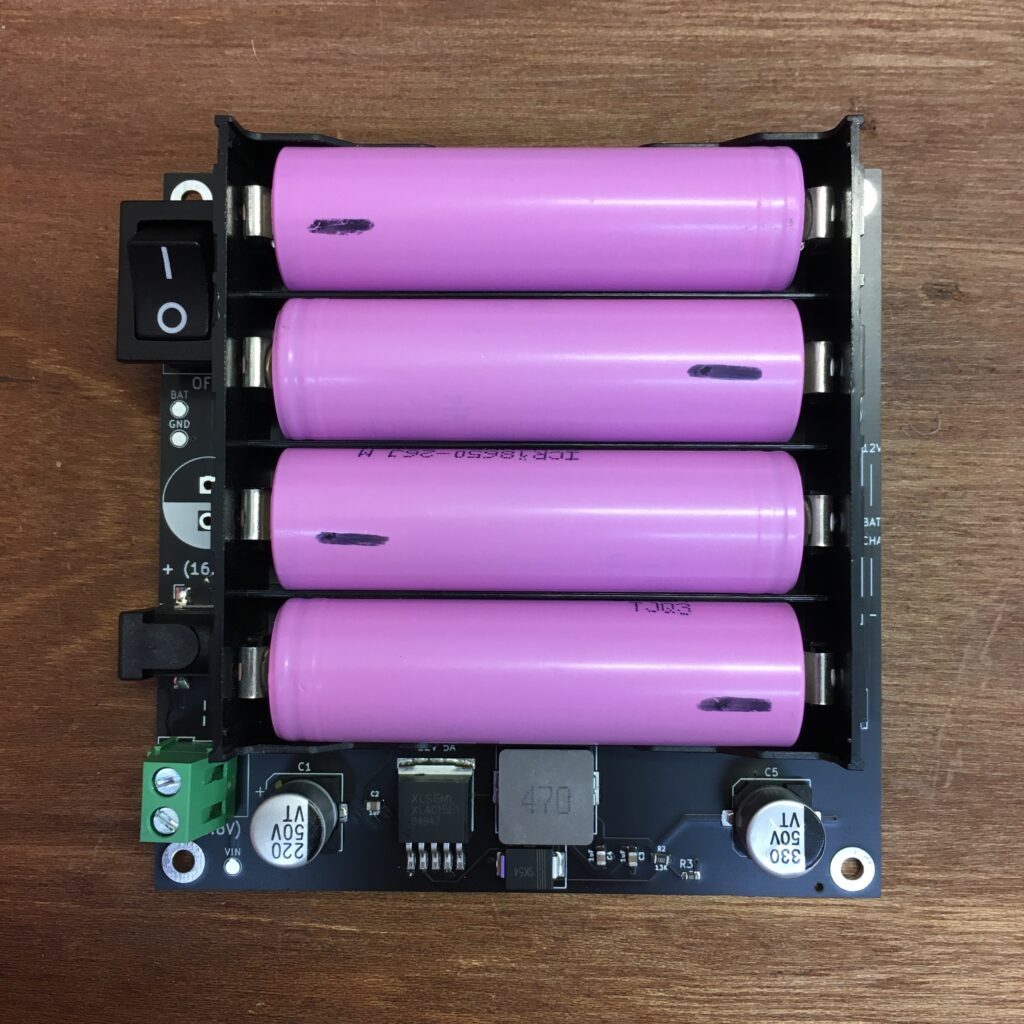


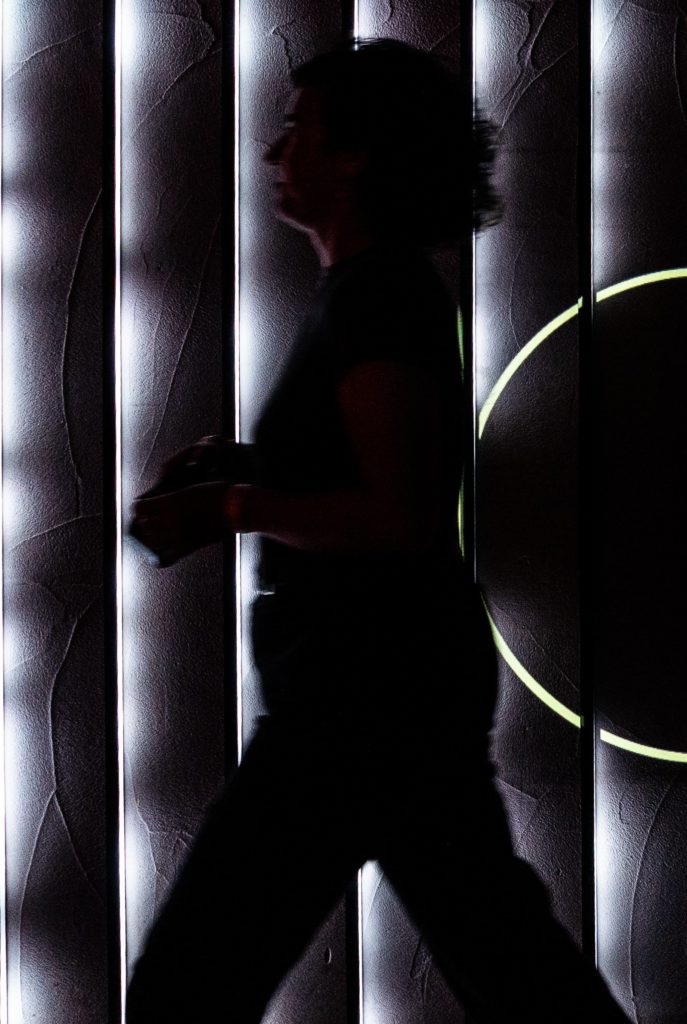
A kinetic light installation, specially developed for Tweetakt 2024. It was shown during the 3 festival weeks on De Neude in Utrecht.
The installation is based on an intriguing technical design, where as much as possible has been carried out in-house. From printed circuit board design to new firmware. This gives the installation a unique feature set and its own character. The artwork shines a light on your imagination by continuously changing orientation. Unsure if the last sentence survived the translation from Dutch to English.
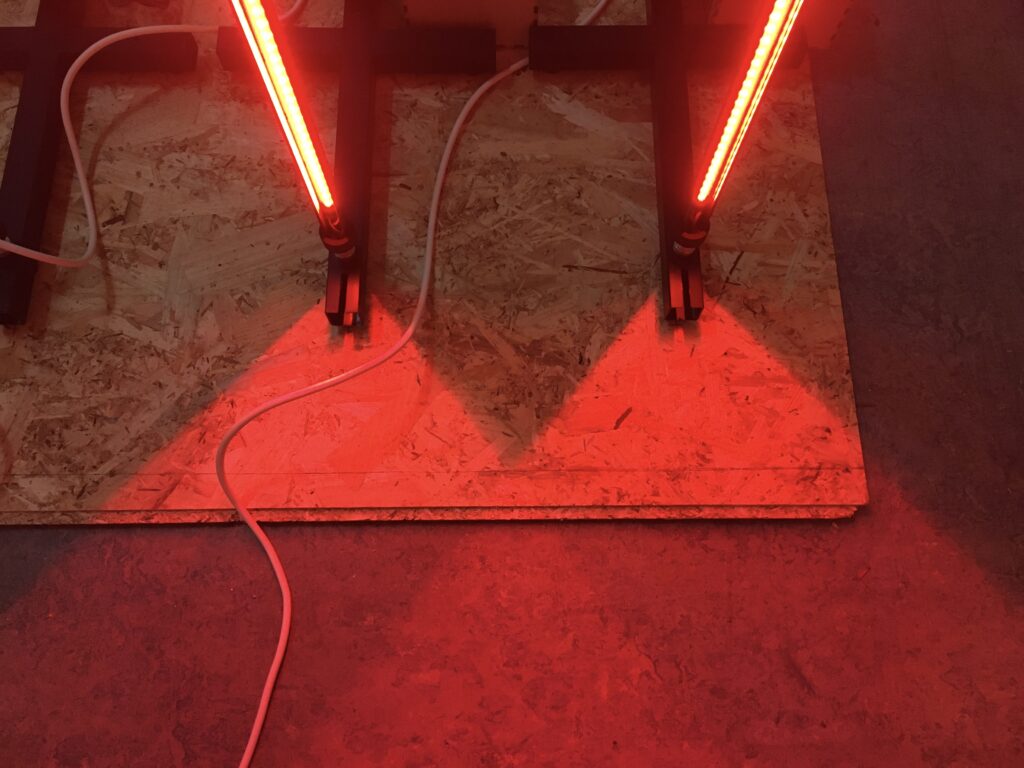
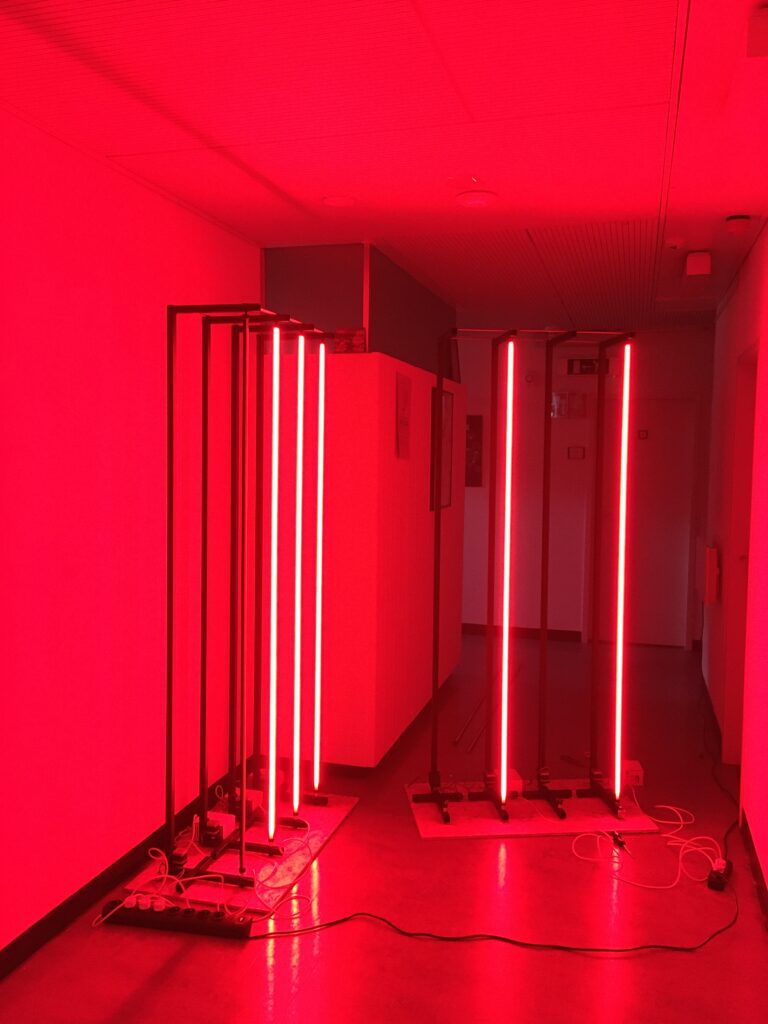
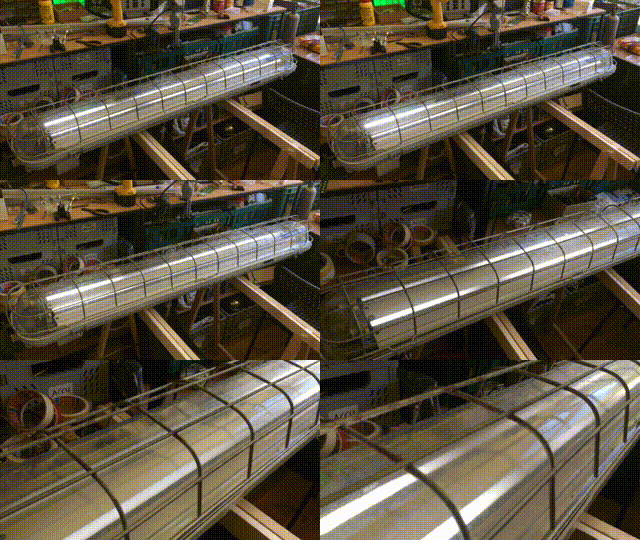
The work consist out of 5 repurposed TL fixtures of approximately 1.4m high (1.7m including the stand). The fixtures are of industrial grade and are German made. They’re found in a local second hand hardware store.
The TL fixtures keep their visual appearance but they’re modified on the inside to fit a new function.
The new function of the fixtures can be described as: a wireless controllable light-instrument, capable of dynamically changing it’s light emission on pixel basis.
To suit this new function custom electronics have been developed by the artist.
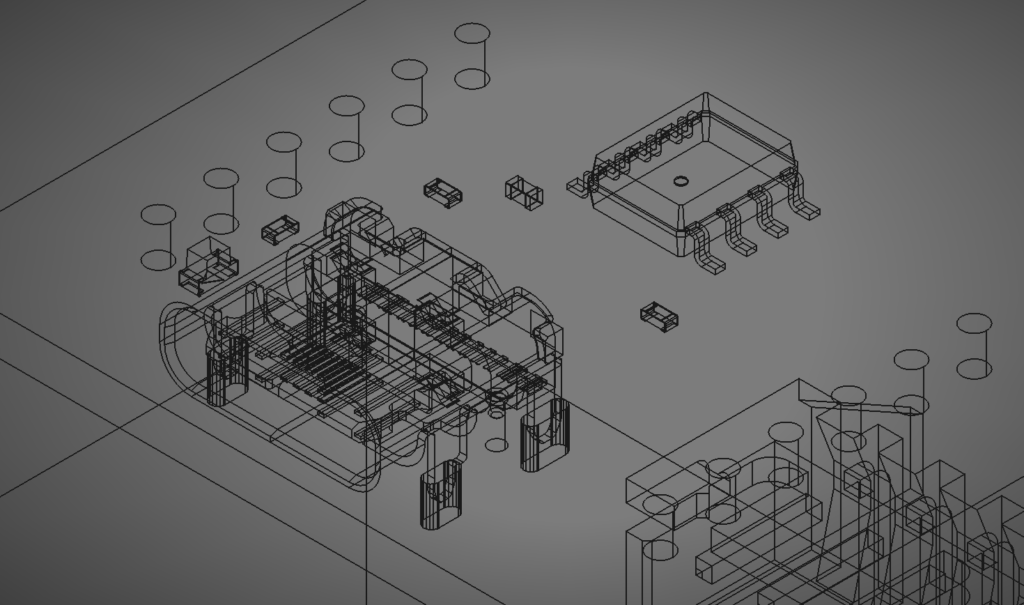
A custom motherboard and custom ledstrip have been designed and developed.
The original electronics are removed and disposed of properly.
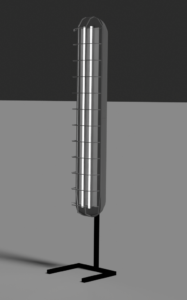
The objects are monolithic in their appearance and of human height. By using a familiar object there’s a contextual starting point.
The fixtures communicate with our senses via light (as expected from a light fixture). The installation also consists out of a speaker system. Making it all together an audiovisual art installation.
The complete set of light-objects can be seen as a disintegrated screen, consisting of spaced columns of pixels (imagine you put multiple vertical pieces of black duct tape on most part of the screen you’re reading this on).
Due to the vertical viewing space it reminds of a slit used in light experiments (and quantum mechanics).
Conceptually it also plays with the resemblance of a slit screen. The lights are forming one image the viewer can distill (imagining the output back to the input). So the viewer can imagine more information than there’s presented via the beams. Sort of Reading between the lines.
When working with digital media it is often a challenge to get away from the computer and screen (perhaps the most used interface method of a computer). Partly for this reason this installation is created, as a new interface between human perception and digital data. The data can be seen as a composition (as it is composed), resulting in both sound and light.
The driving data is mostly based on math and numeric transformations, a fundamental concept of music.
The installation shows multiple states that explore both the capabilities of the system as the perception of the viewer.
The sound moves between soundscape and music, mostly having an electronic sound (noise, clicks, percussion, synthesizers, samples of machinery, etc).
These sounds are initiated by a live system, that generates a score on the fly.
The events from this score are mostly apparent in both sound and light simultaneously.
The output isn’t always rhythmic or repeating, it can also be random or chaotic.
A main driver for this artwork is the artistic and technical exploration.
The goal is always to design new interfaces that are customizable, scalable and modular.
The wireless control isn’t a necessity for this work, but by creating it this way it can be used in a later stadium or version (outdoors with battery-packs for example). Or the wireless system can be used to capture data emitted by smartphones to drive the systems activity.
The artistic exploration happens after the development of the hardware and software. What shapes can be created with this new canvas? How does it feel when we shift time synchronization of the light and sound? Or what happens when we link frequency with brightness in a non-linear manner? Questions to figure out and to play with.
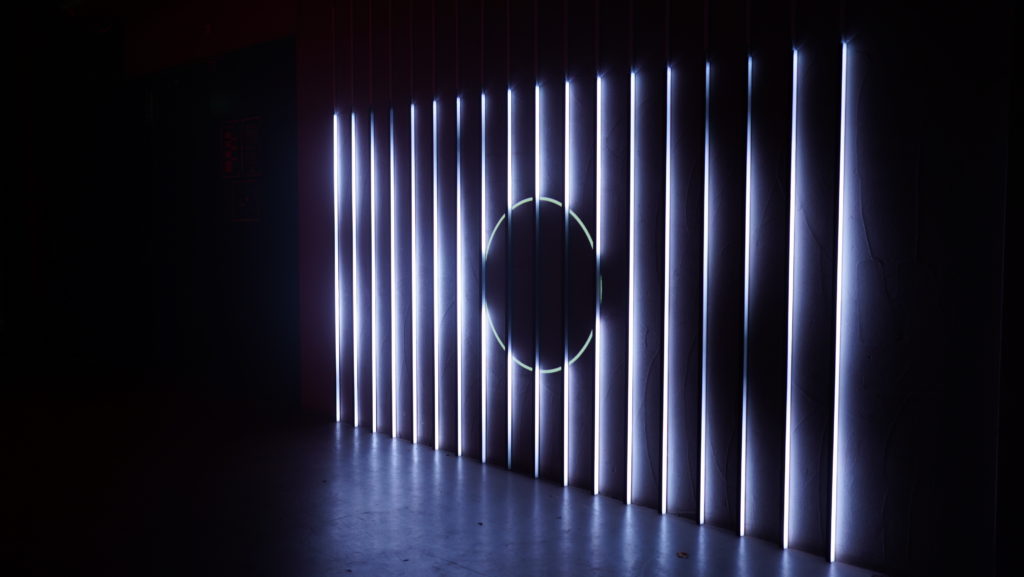
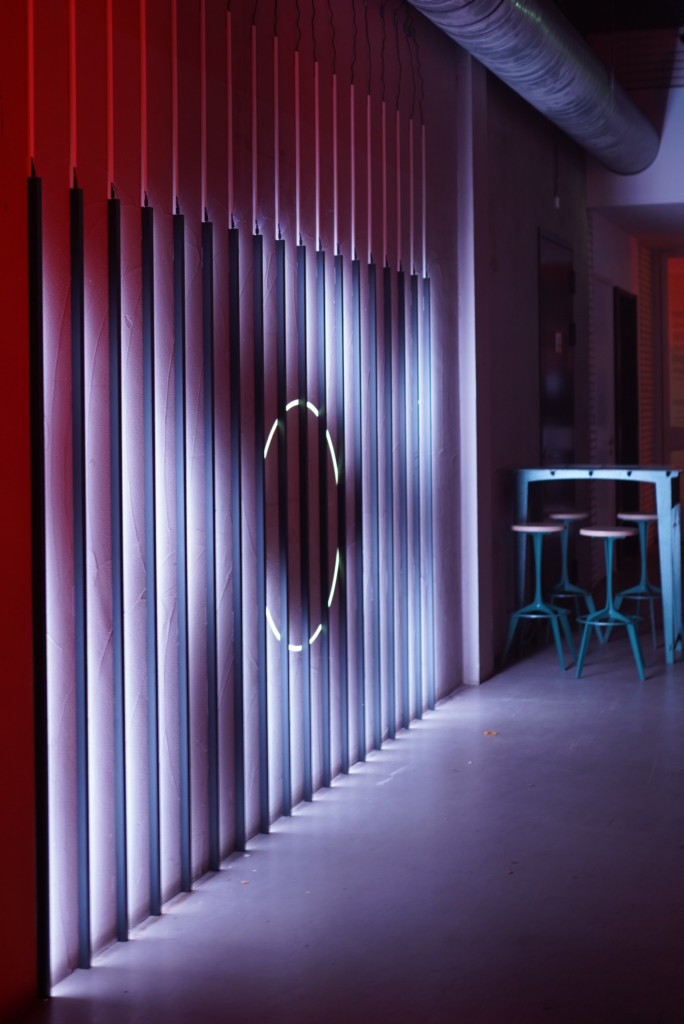
An installation that shows multiple vertically aligned beams that emit beams of light.
The visual slowly moves and changes based on perspective and time.
Premiered @ Freaky Dancing, WAS-ruimte Utrecht, 10-2022.
Version 2 (w/ audio) was shown @ Stukafest Utrecht, 16-02-2023.

Early experiments with SuperCollider uGen development in C++.
The video below shows the use of a custom onset-detector. The onsets (beats) in the music activate some triggers in the visuals software (written in C++/openFrameworks).
Made for GS1, a not-to-profit organization known for their work on the barcode (!), France, 2020-2021.
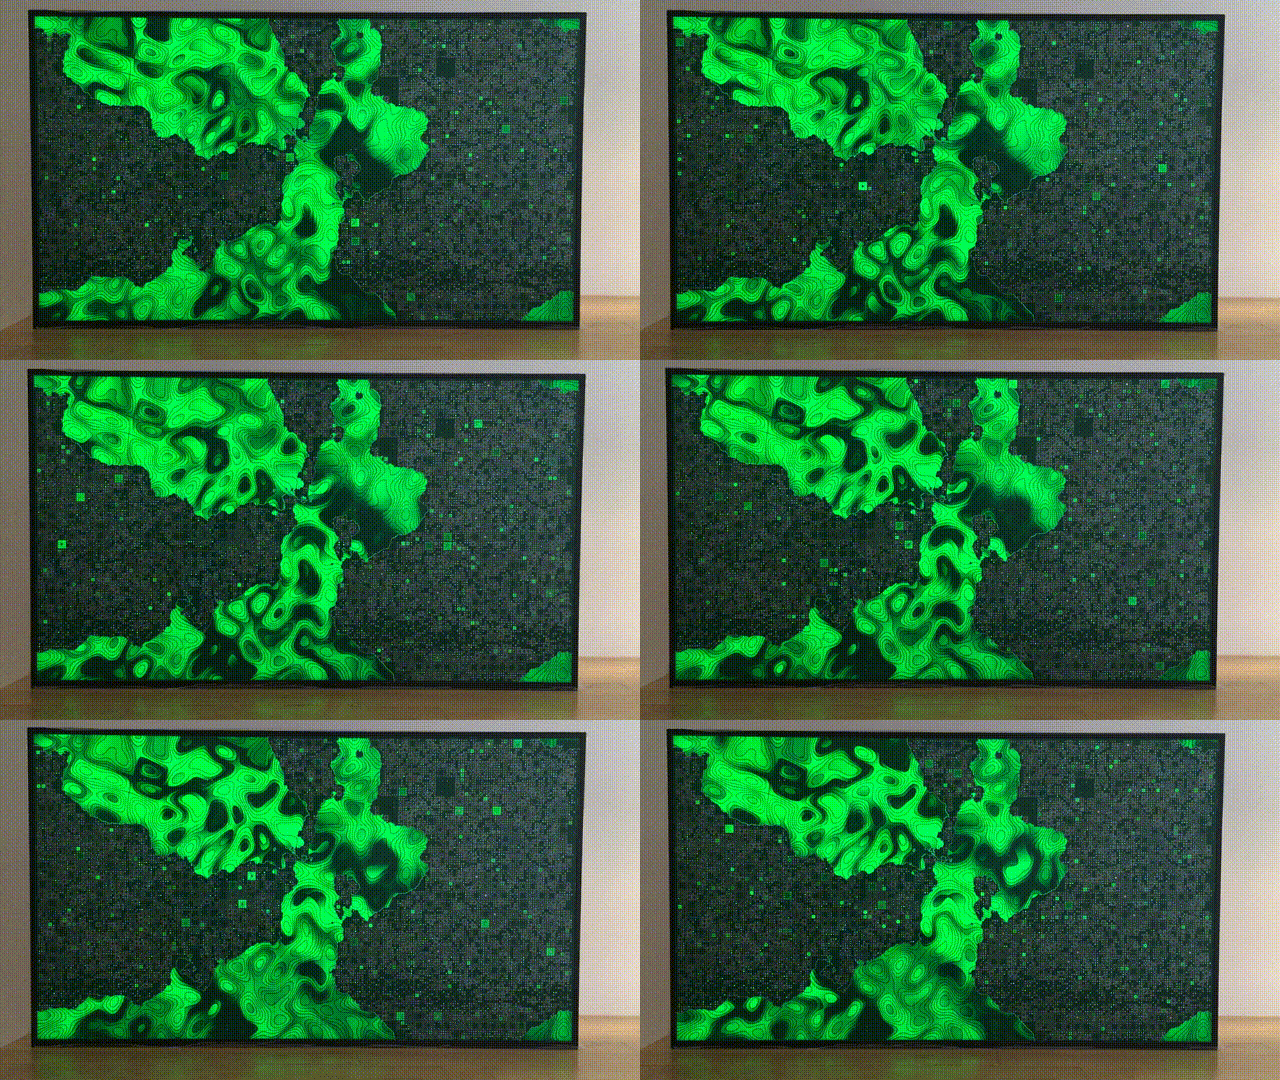
– Traceability
The traceability solutions of GS1 are translated into the work by making use of copper-traces. These copper-traces are usually part of an electronic circuit in a printed circuit board (PCB). The traceability-aspect is quite literally present in the work.
– Transparency
The installation makes use of the transparent properties of the materials. The PCBs are very thin and light is able to shine through them. The LCD-screen uses pixels to block light at certain areas.
– Circular, collaborative economy
The generated traces are used for showing forms of traffic / transportation, which looks similar to traderoutes. It’s mimicking transport from countryside to a city, and visa versa, or in a circular pattern.
– New technology
The theme technology is very visible in the material by using a designated technical material.
The composition and visuals of the artwork are generative, meaning that it’s all algorithmically generated.
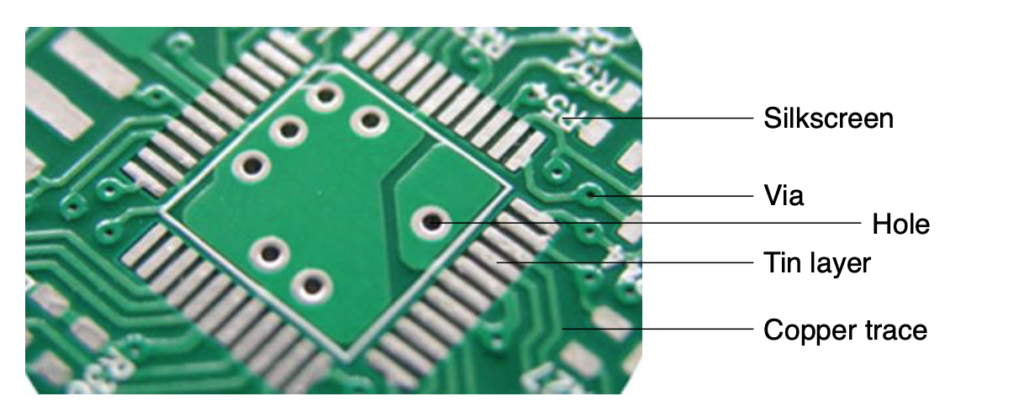
PCBs are made of a glass fiber reinforced epoxy resin with copper traces running through it. These traces are normally used for transmitting electrons which are mainly used as signals for computers. Most common are two-sided PCBs, with traces on the top and the bottom.
The traces are only visible from one side, but by lighting the back of the PCB the traces on the other side will also become visible.
On the top of the PCB there are tin pads and holes, used to place components (resistors, capacitors, transistors, etc) upon or through.
Besides the tin layer there’s a white print (silkscreen), to indicate the position of the components and other information.
All these layers will be used for the canvas of Tracing.
The installation will consist of a PCB layer in front of an 49″ LCD screen. By lighting pixels on the screen, specific areas of the PCB-layer will be lit / shown. Therefore the visuals on the PCB-layer and the screen will correspond strongly (and are almost identical).
The final piece should show a reference to geography, to emphasize the relation between (global) transport and logistics. I want to generate a land/sea-like pattern. When researching this I found the wonderful Diamond Square algorithm. This starts with four points and interpolates new points between them. This recursive process is repeated a number of times.

This algorithm creates a 3D structure, but I need something two-dimensional. In the 3D-model I place a black flat surface that acts like a water level. I let the program adjust the water level repeatedly until the water/land-ratio is similar to earth.
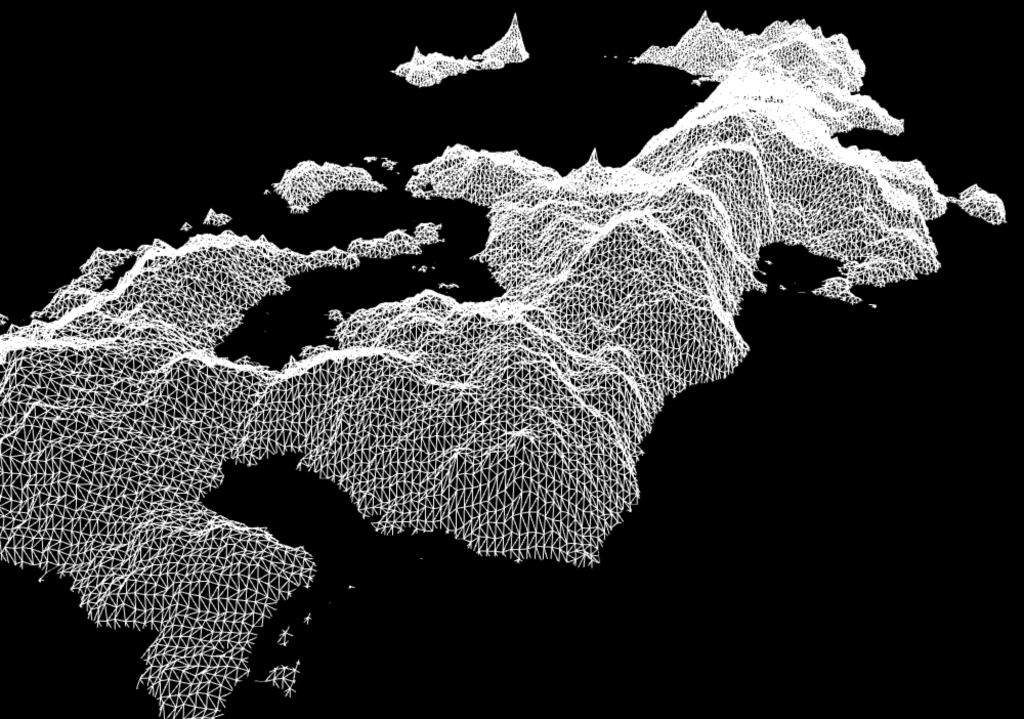
The 3D structure is rendered to a 2D drawing by checking the z-position of each point, is it above or below the water level? If it is above water, it draws a white pixel.
I want to have a direct reference to a natural process.
Therefore I use a photo of the Wadden-sea (The Netherlands, photo by Timo Visser).

The picture shows some unique structures and colours.
At first I try to translate the picture to simple data that refers to certain spots of constant color.
The derived data is a bit too spaced, since I want to use it for placing cities and hubs. Therefore I try another approach: translating the image to a quad-tree image.
This means that the image is analyzed on color. Sections of pixels are grouped based upon their corresponding color. This resulted in the following images.
The quad-tree image combined with the map looks like this:

For the visual appearence of the sea I’ve used a squaremarching algorithm, with Perlin Noise as an input.

The two combined:

To translate this design to a PCB I’ve use the open-source software KiCad. This is a fully featured program to design functional PCB’s. My goal here is to use it as an artistic medium.
I’ve chosen KiCad since it’s open-source and has a scripting capability. This means I can write my design in code.
So translating the design above is quite straightforward. A filled rectangle would be created like this (C++ to generate a Python file):
string line = "";

line += "p = pcbnew.DRAWSEGMENT()\n";

line += "p.SetLayer(layertable['"+layerNames[layerID]+"'])\n";

line += "p.SetShape(pcbnew.S_POLYGON)\n";

line += "points = pcbnew.wxPoint_Vector()\n";

for(char i=0; i<5; i++){

    line += "points.push_back(pcbnew.wxPoint(pcbnew.FromMM("+ofToString(pixelToMm(coords[i][0]))+"), pcbnew.FromMM("+ofToString(pixelToMm(coords[i][1]))+")))\n";

}

line += "p.SetPolyPoints(points)\n";

line += "p.SetWidth(int(pcbnew.FromMM(0.00127)))\n";

line += "board.Add(p)\n";
The full KiCad python API can be found here.
The blocks on the map reflects hubs, cities or likewise entities. My final goal is to visualize traffic between these places. Therefore I have to create some connections. Almost all entities are connected via each other.


To give these lines an actual PCB-like visual appearance I’ve used freeroute. That’s software that generates traces on actual PCB designs. It connects all the straight lines in the image above with typical 45-degree-angled lines.

Each rectangle has its own look: number of holes, lines and accents. The width of the traces is matched by the size of one pixel.

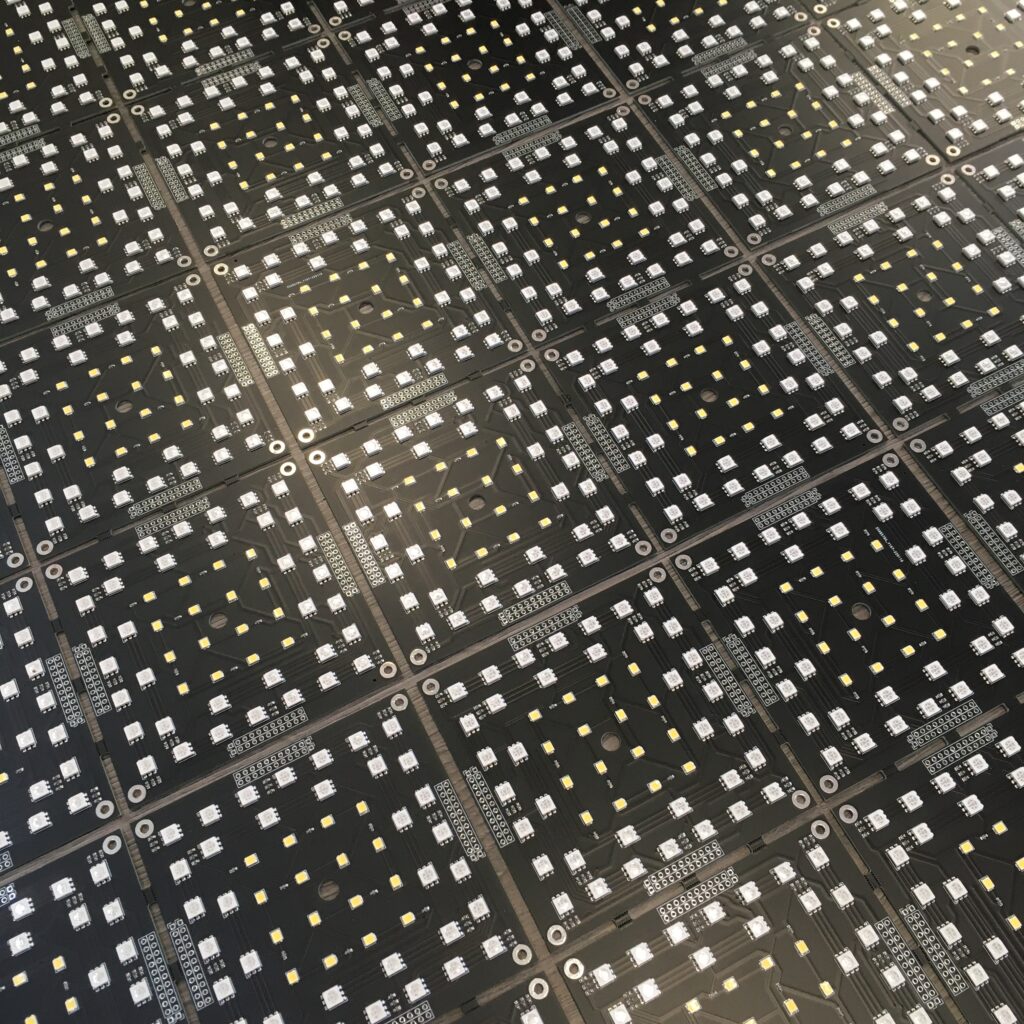
The PCB layer won’t be one solid 66x112cm piece. It isn’t possible to get a 0.6mm PCB of this size manufactured. So it will consist of multiple parts (<10x10cm). It’s also more genuine to keep the PCBs small, as they usually are of small dimensions.

The challenge is to divide the full scale design into different small PCB’s.
All lines on the PCB are checked if they’re within a certain range, like this:

This way the whole design has been divided in certain sub-sections.
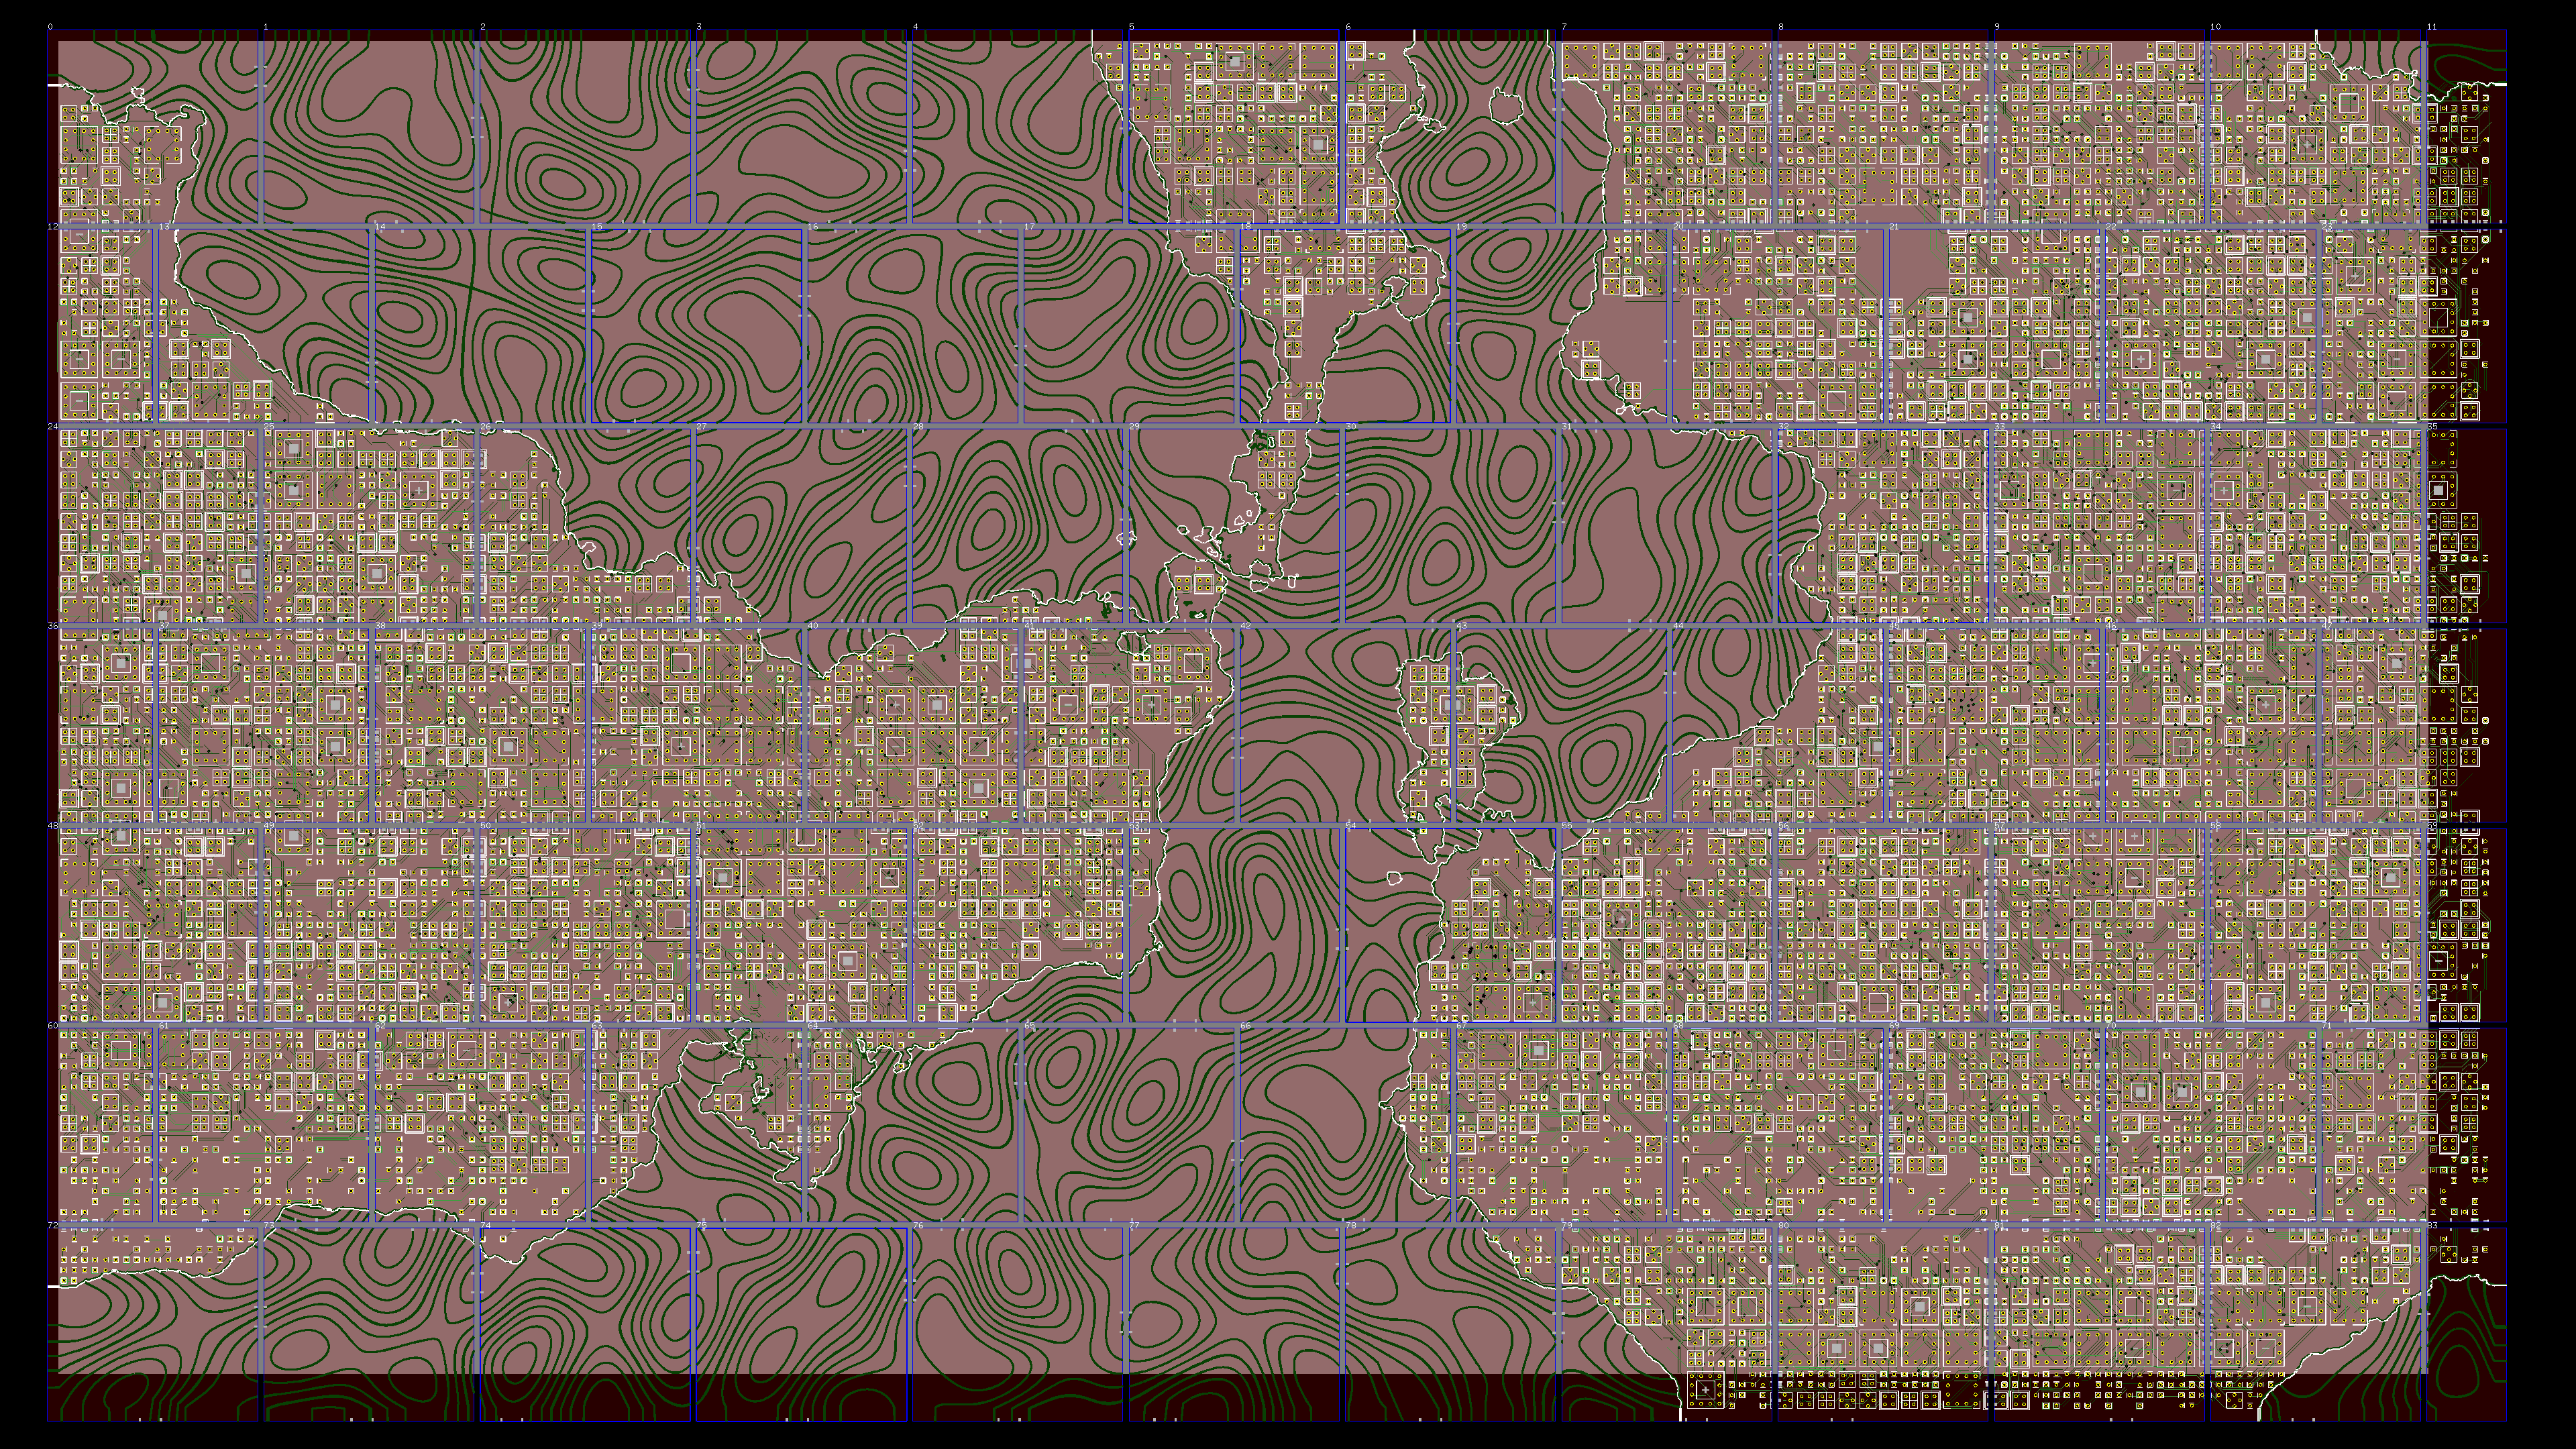
A single board looks like this (Board #70, top view):

All the seperate PCBs are arranged and then soldered together into one big PCB.
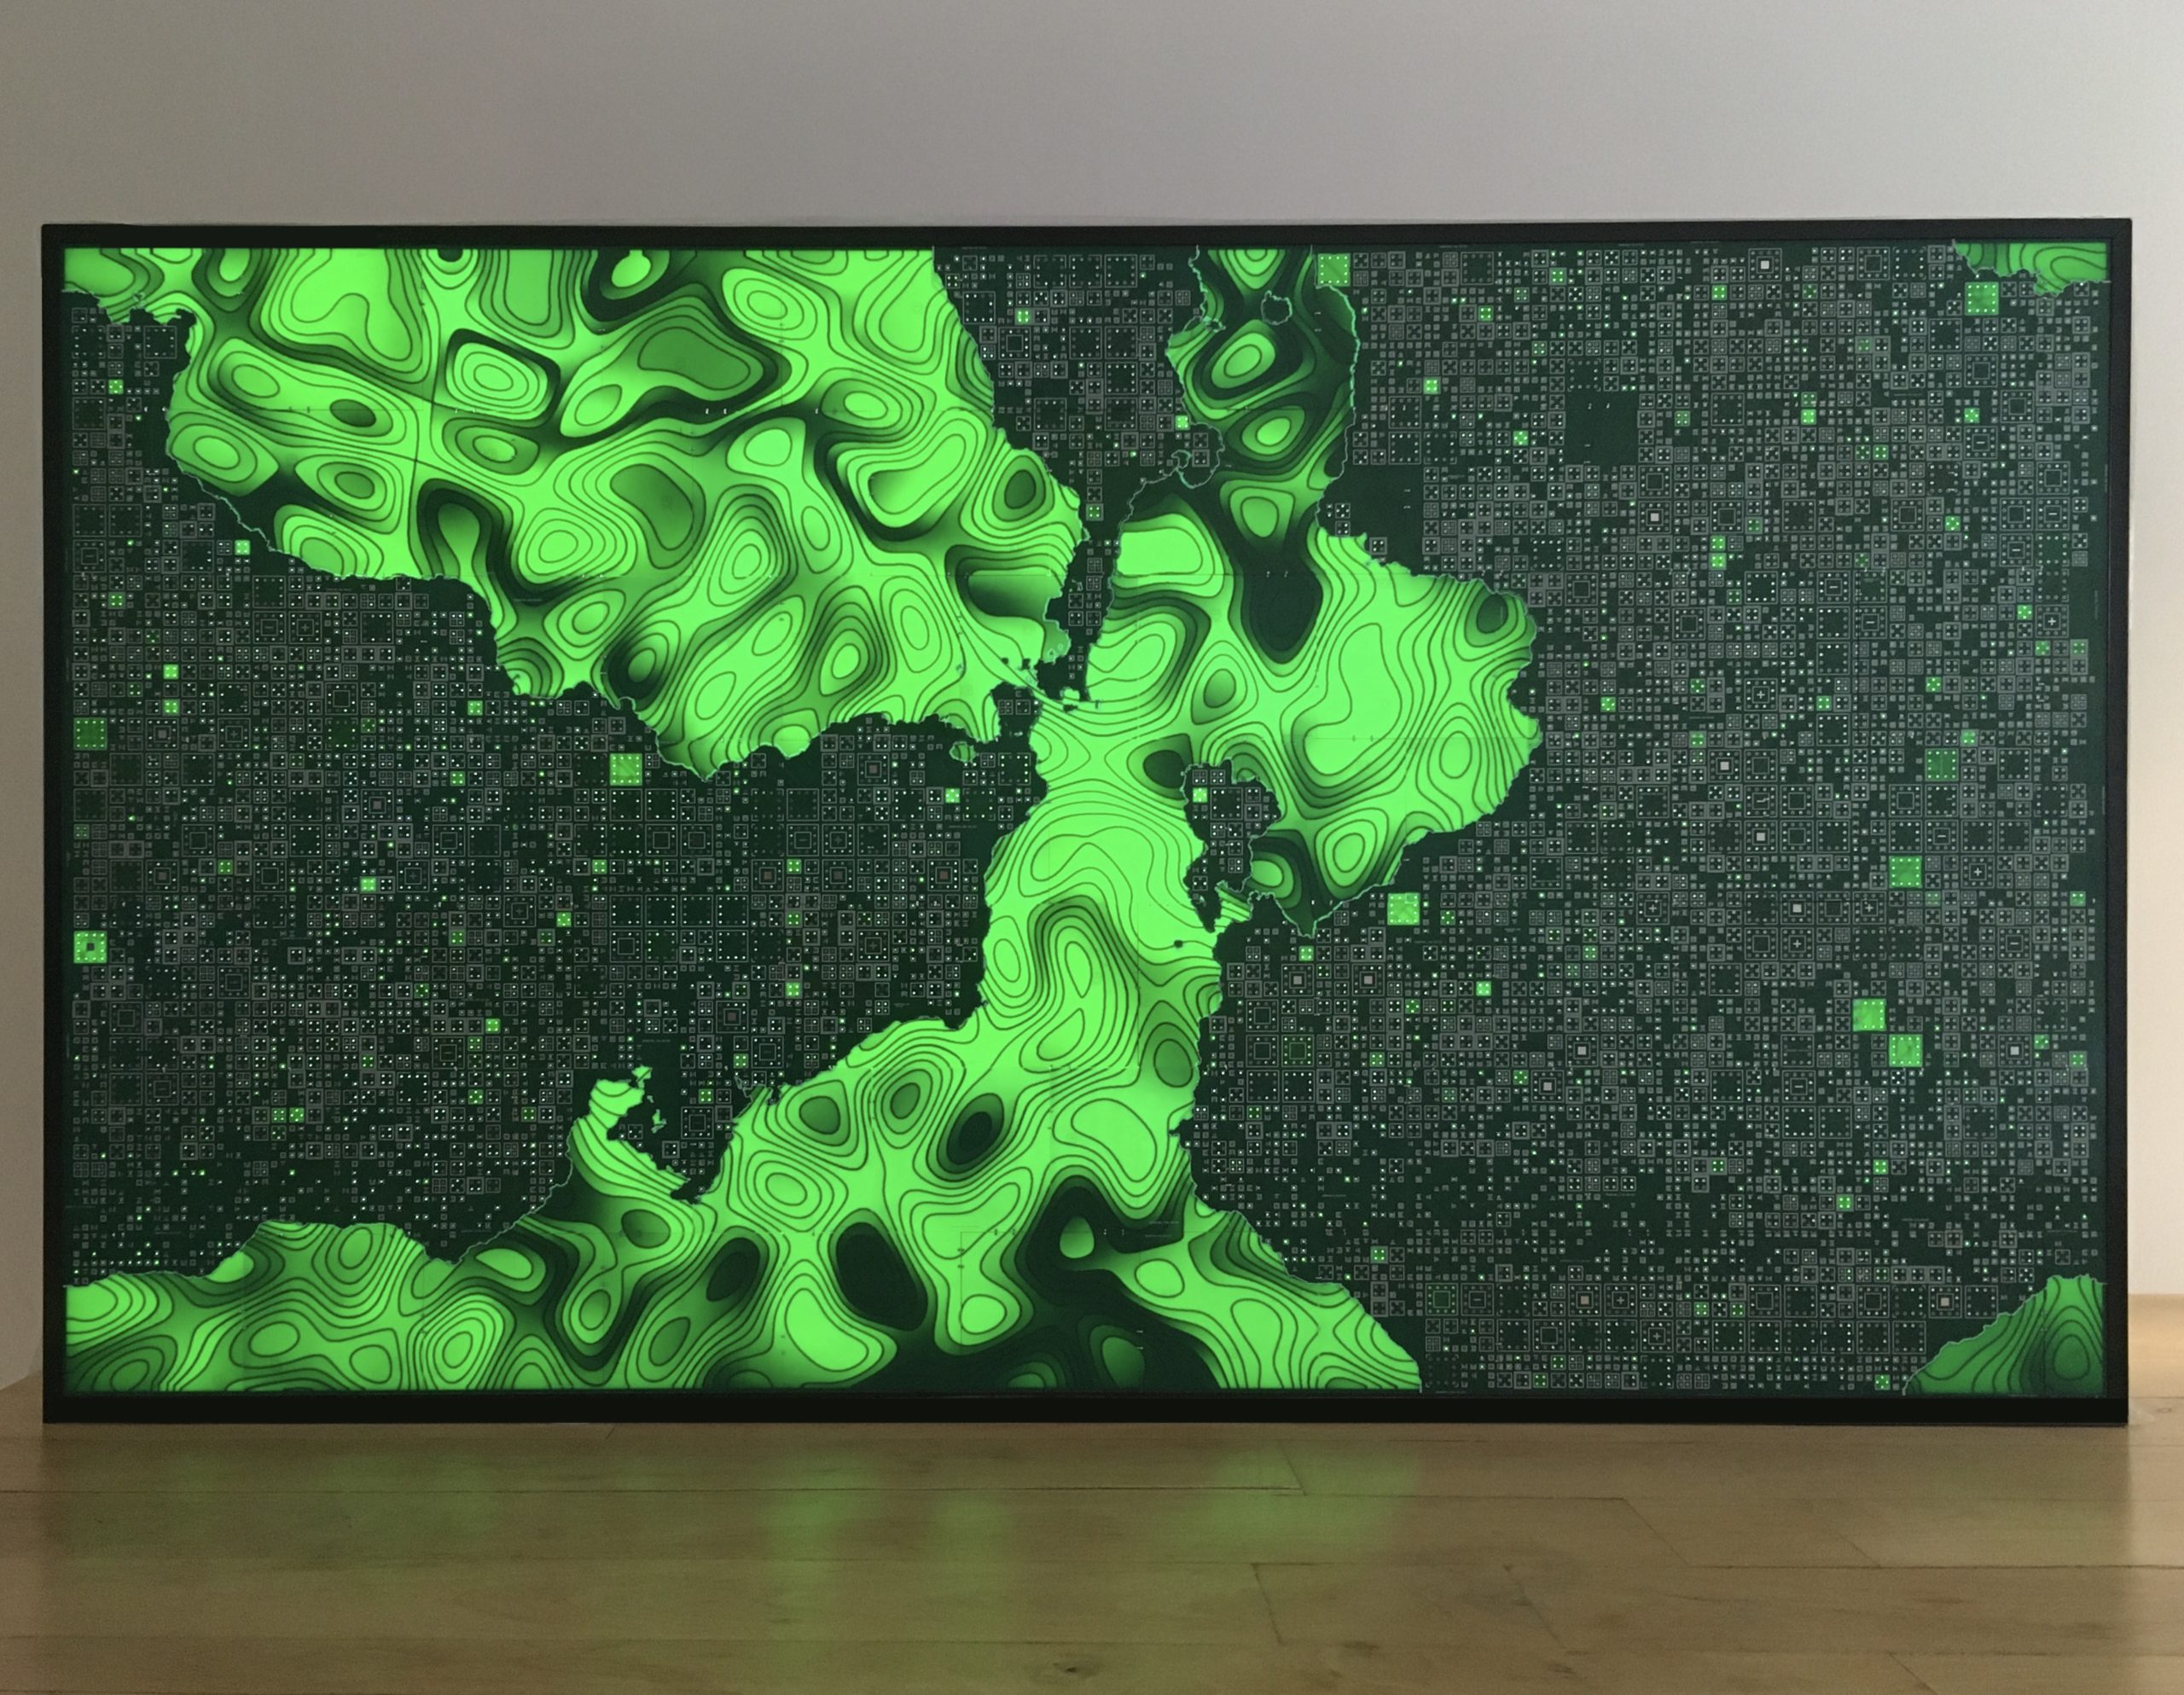
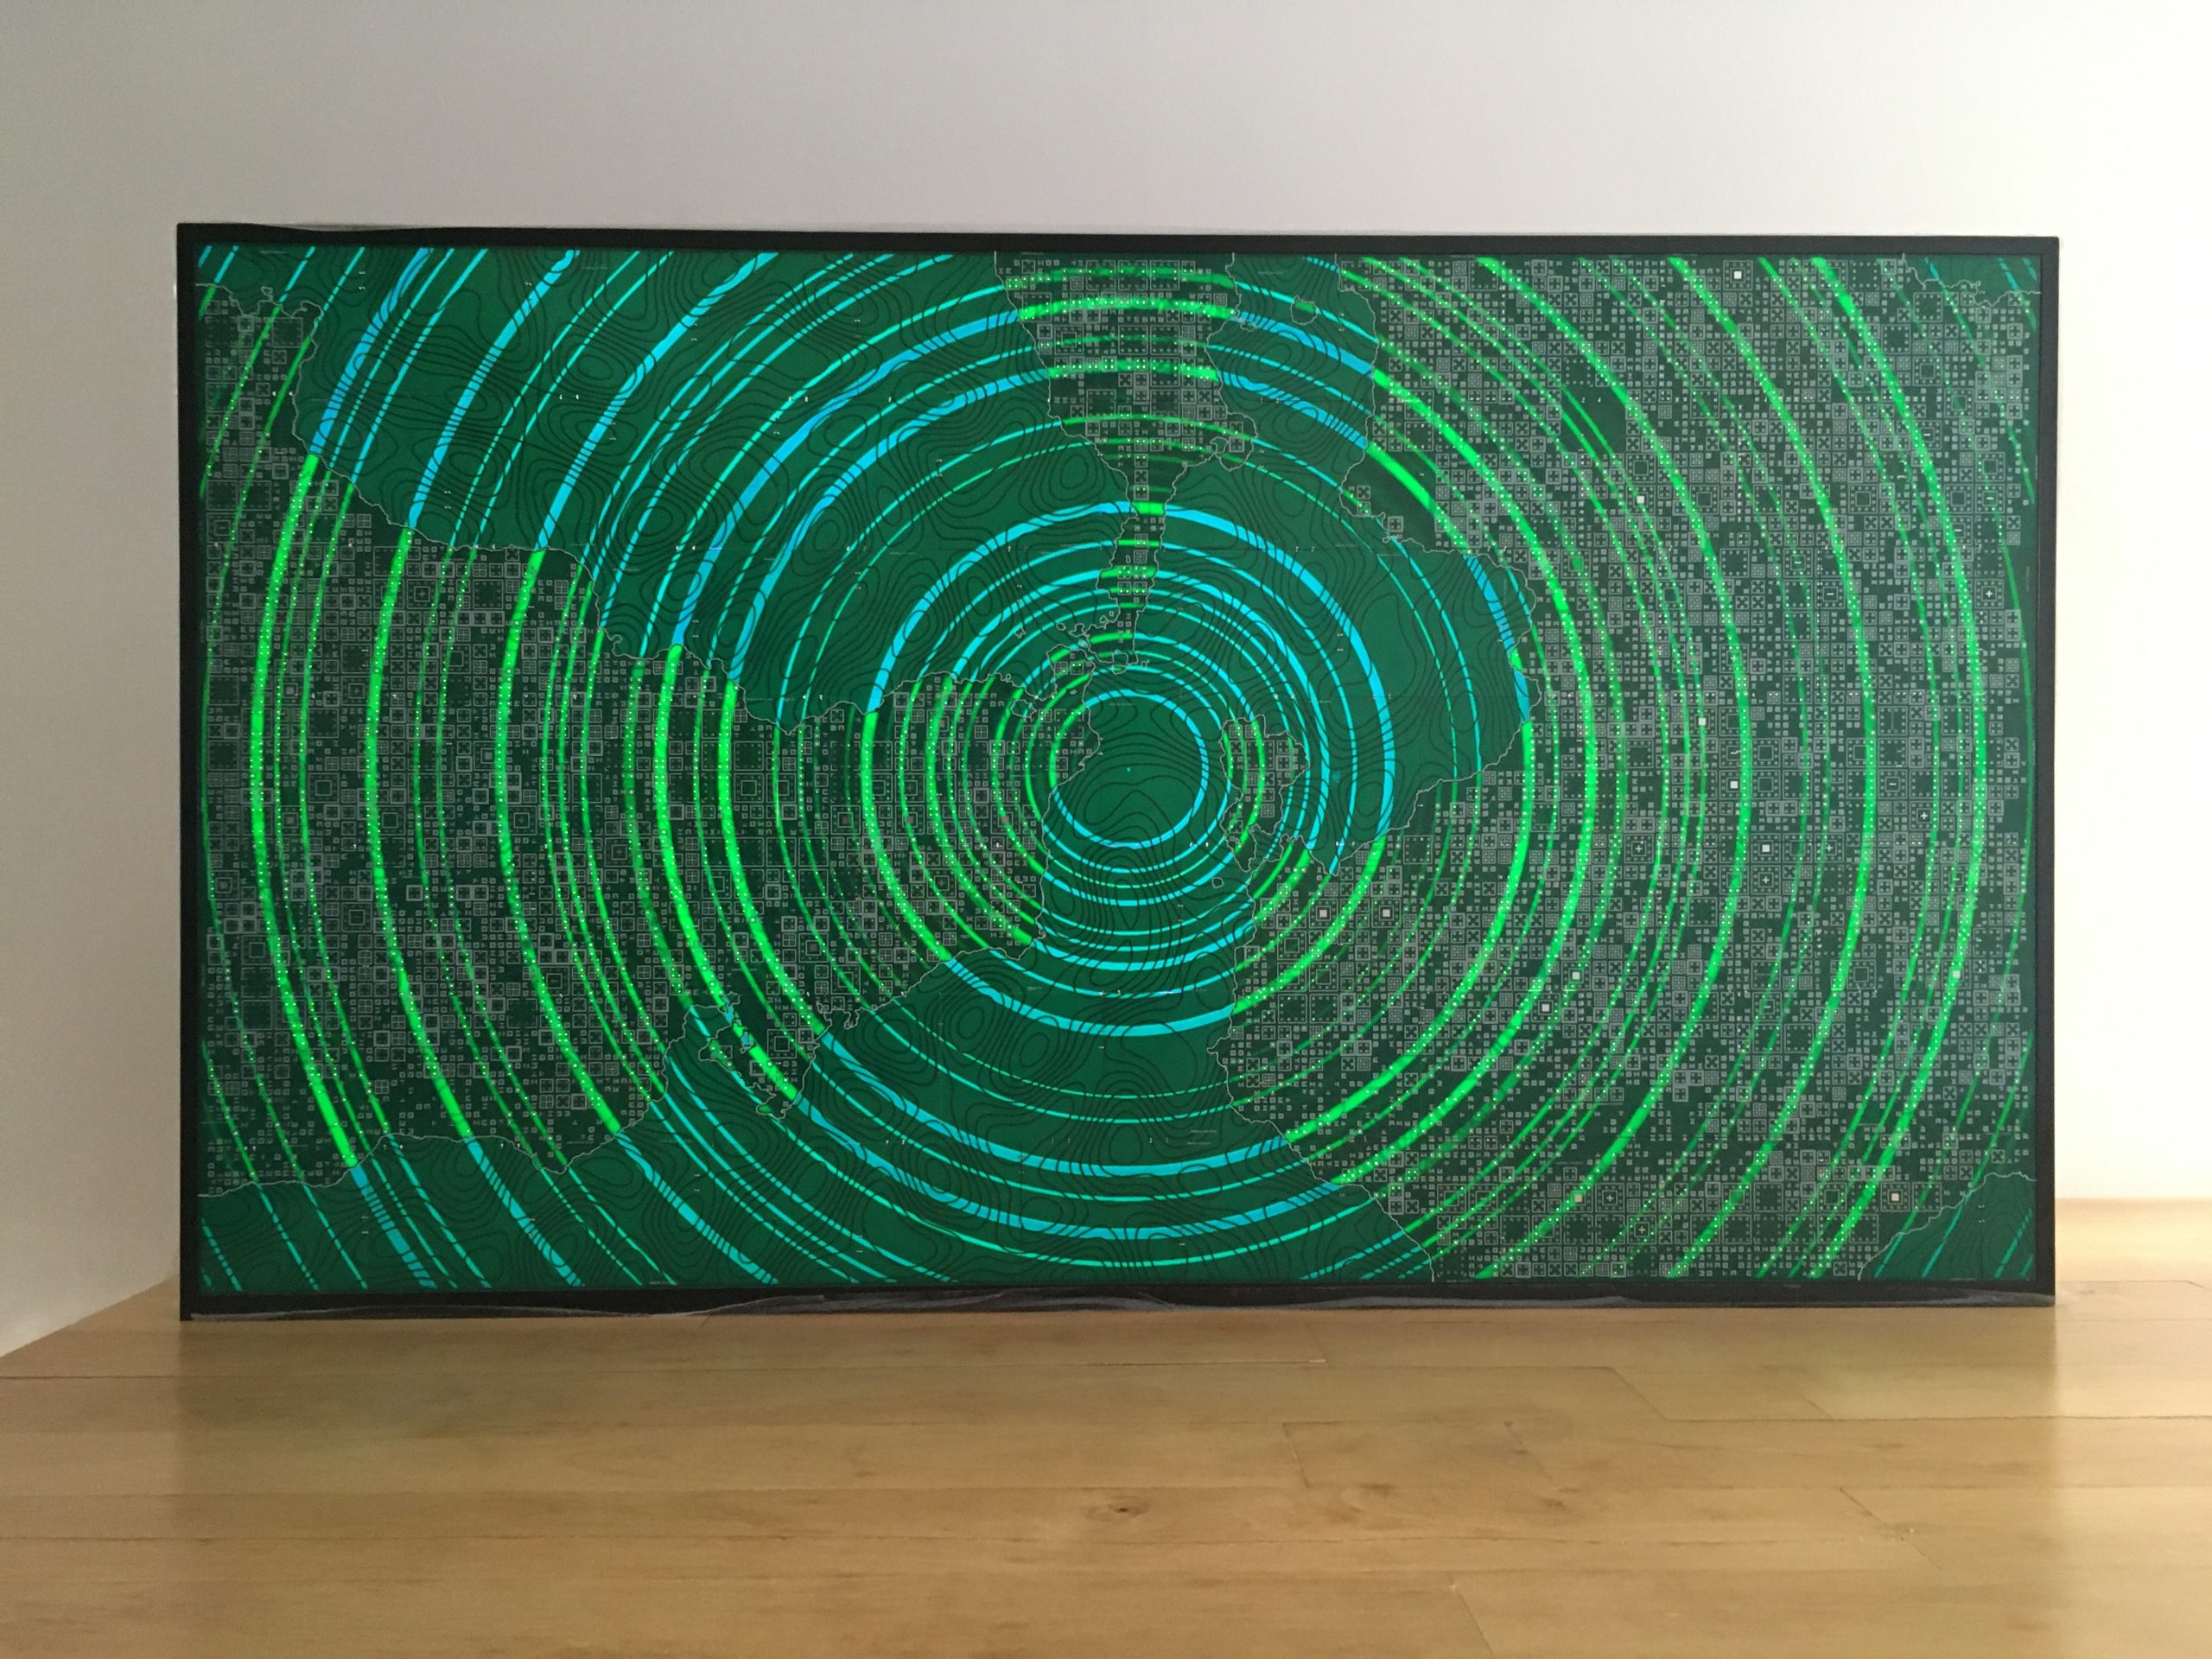
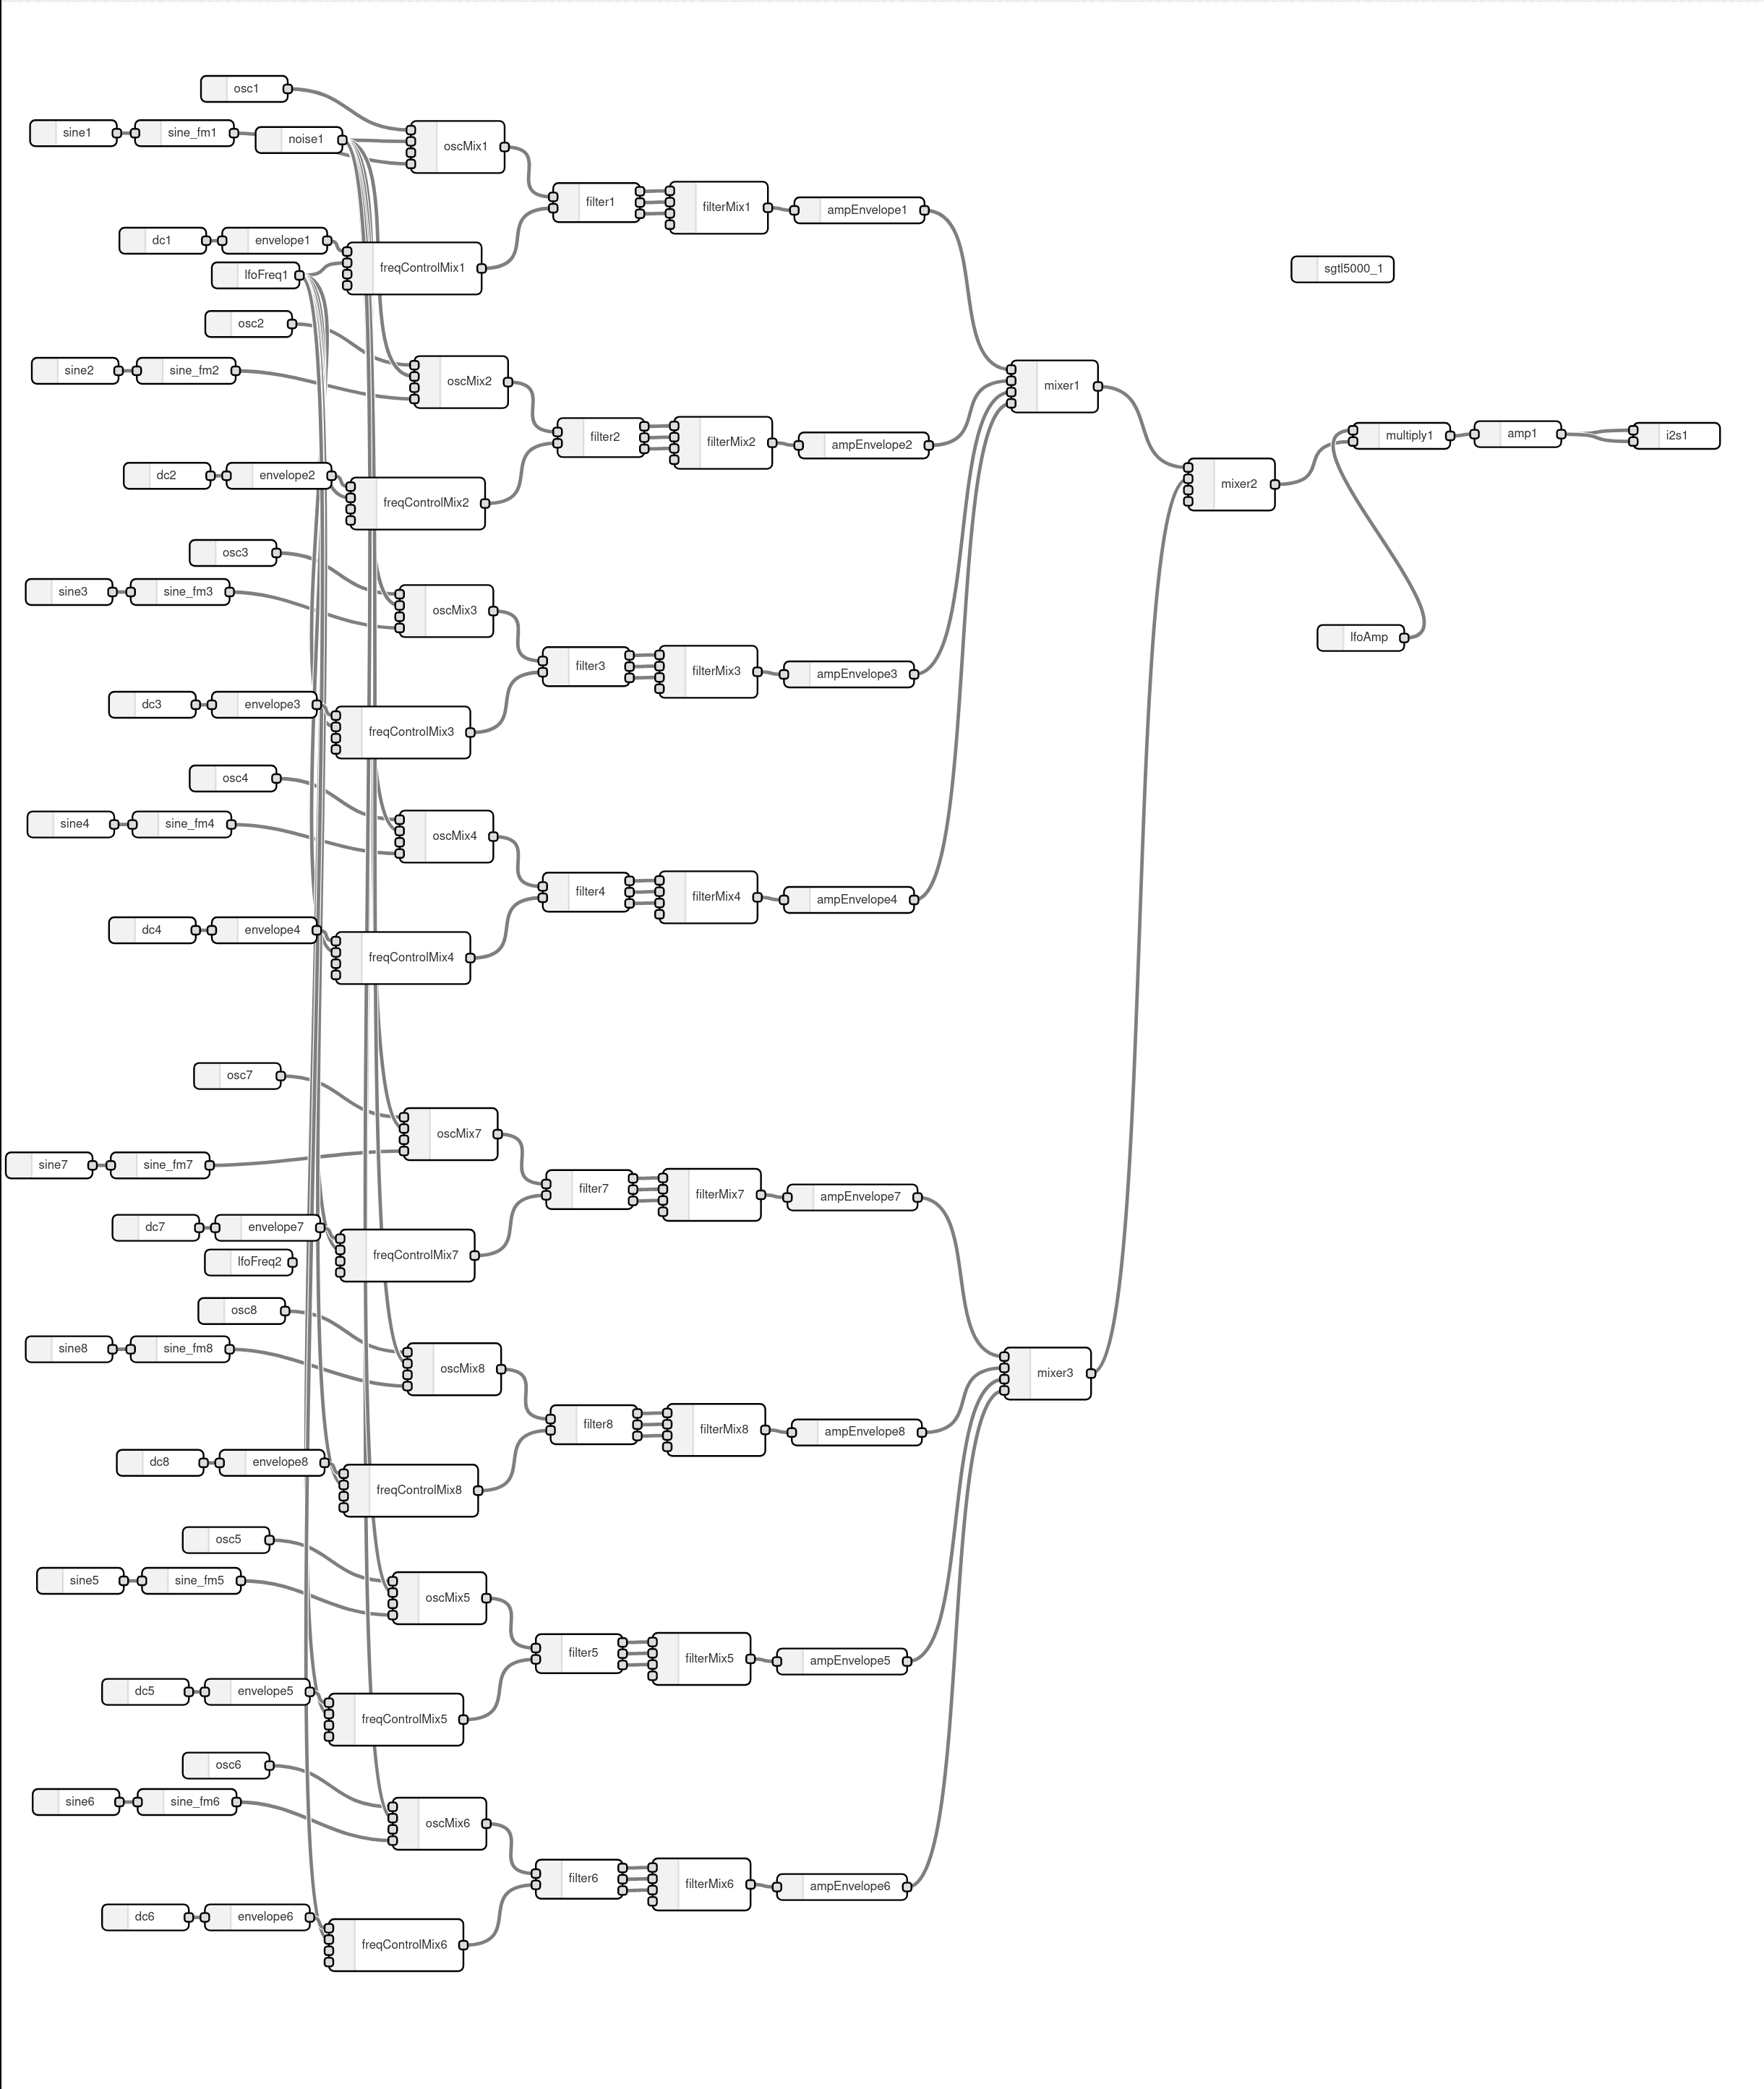
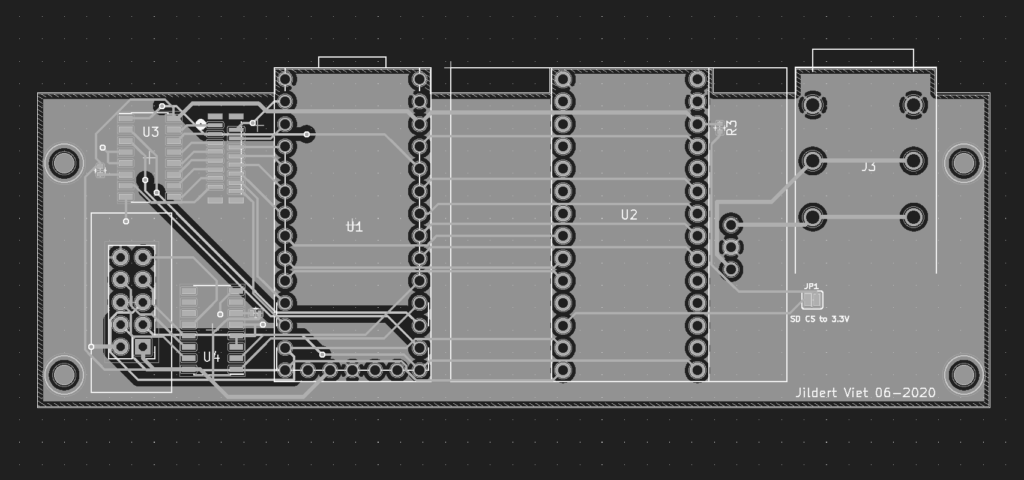
Programmable digital synthesizer based on the Teensy 4.0 microcontroller.
Signal flow of the synthesizer
Improvised visuals for some of the Bimhuis Soundsystem-nights @ Bimhuis, Amsterdam in 2018-2019. Curated by resident Radikal Rupert. Below are some stills of the visuals and posters.
Batobe is an electronic music act, with a custom audiovisual liveshow. Batobe performed behind a translucent screen with live generated visuals.
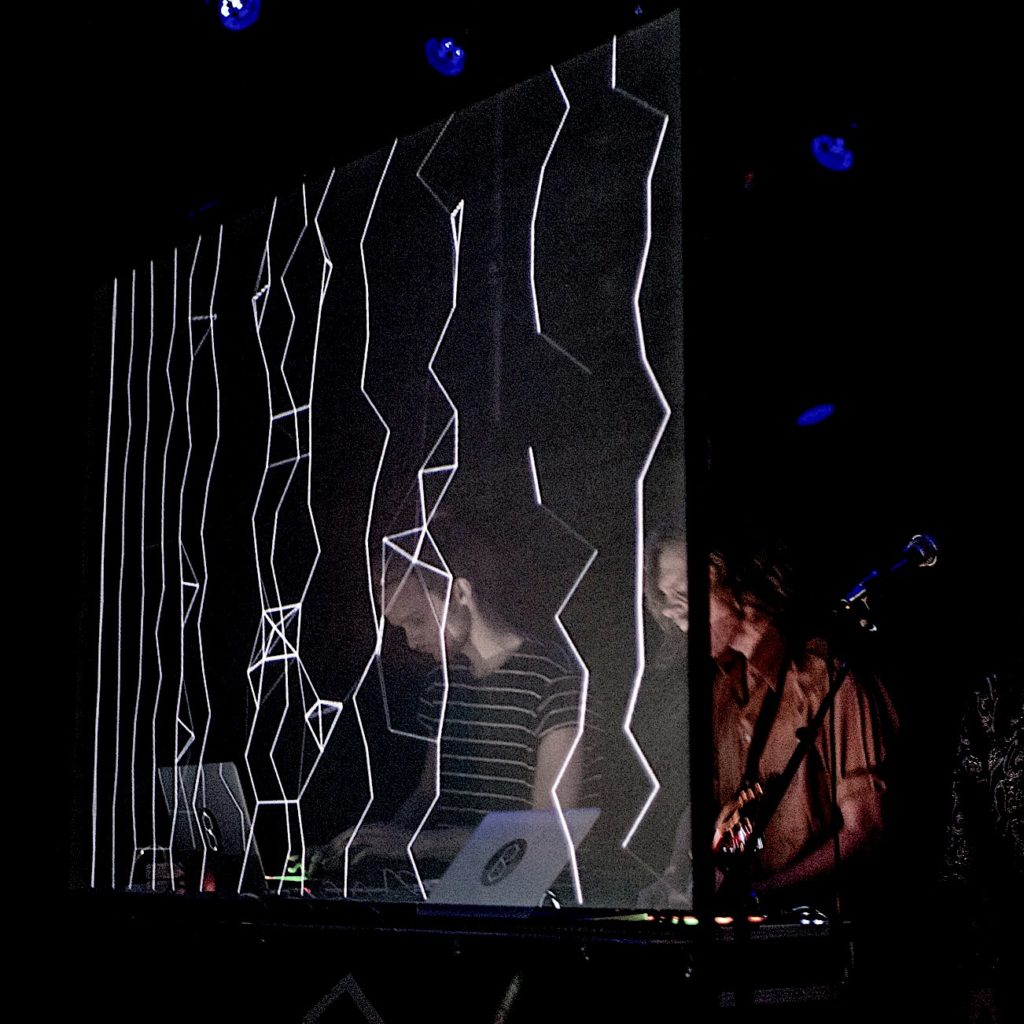
Selection of liveshows:
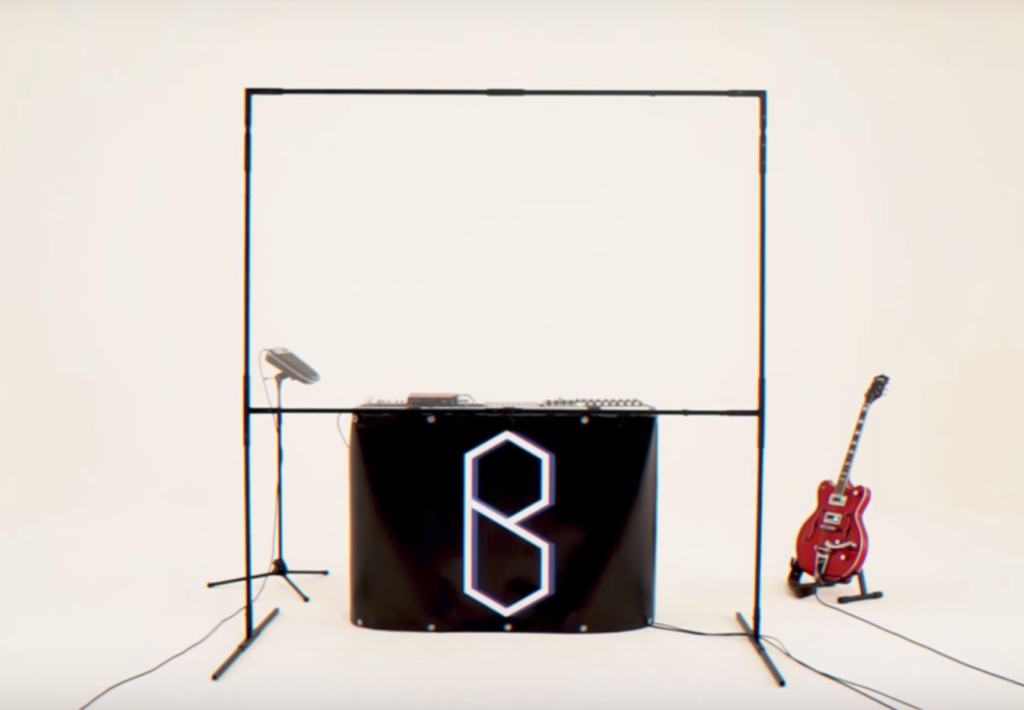
Artwork for Mirror, a still from the live visuals ⬆